 Oluwadi
Investigating the Overlooked
Region
What
Who For
Analysis
Oluwadi
Investigating the Overlooked
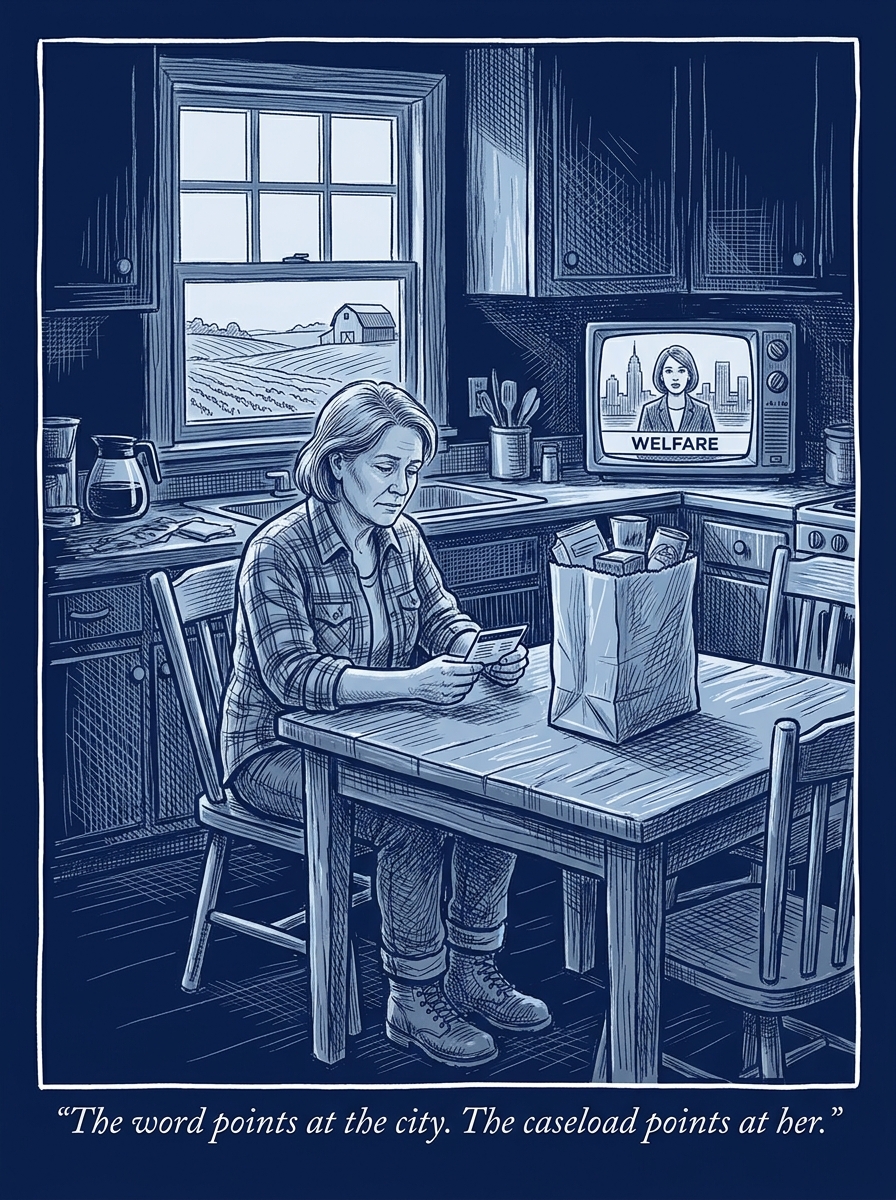
Rural and small-town counties had an average SNAP participation rate of 16 percent between 2011 and 2015, compared with 13 percent in urban counties -- rural America relies on food assistance at a meaningfully higher rate than the cities the word "welfare" is culturally coded to.[1] That gap has persisted across more recent USDA analyses too, driven by higher poverty rates and thinner access to alternative services outside metro areas.[1] The country's dominant image of who depends on government assistance, and the actual geography and demography of who does, have been pointing in different directions for decades -- and the gap between them isn't an accident of bad reporting. It's a documented, mechanical result of how the media chose to illustrate poverty.
The mechanism that built the mismatch has a name and a rigorous, decades-old study behind it. Political scientist Martin Gilens spent years analyzing how American television news and newsmagazines visually illustrated stories about poverty and welfare, and found the coverage systematically overrepresented Black Americans -- and did so unevenly on purpose, whether the producers intended it or not: sympathetic stories about poor families disproportionately used White faces, while critical, skeptical stories about welfare disproportionately used Black ones.[2] Gilens' core finding was that White Americans came to believe most welfare recipients were Black, not because the caseload was actually majority-Black, but because sustained, patterned visual choices in news coverage taught them to picture it that way. The stereotype did real political work: Gilens links it directly to why welfare became one of the least popular categories of federal spending, even among Americans who otherwise supported help for the poor.[2]
The actual caseload, then and now, doesn't match the picture Gilens found Americans holding in their heads. In the most recent USDA and Census figures, White Americans are the single largest racial group receiving SNAP benefits, at roughly 35 to 38 percent of participants -- more than any other group, including Black recipients at around 25 to 26 percent.[3] That has been broadly true for as long as the program has existed at scale. The stereotype Gilens traced to news imagery was never a description of the program. It was a description of which faces editors reached for.
The same asymmetry shows up at a much larger scale than any single program, in the federal government's own accounting of which states take in more than they pay. The Rockefeller Institute of Government's balance-of-payments analysis -- the net difference between what a state sends to Washington in taxes and what it gets back in federal spending -- has consistently found that high-income, urban, often Democratic-leaning states like New York, California, New Jersey, and Illinois are net donors, paying in more than they receive, while a large majority of other states, most of them more rural and more conservative, are net recipients.[4] In the Institute's 2015 analysis, 37 states received more in federal spending than they contributed in taxes. The pattern holds across nearly every year the Institute has run the analysis, pandemic years aside, when federal relief spending temporarily put every state in positive territory.[4] "Red state, blue state" tracks the same divide almost exactly, and it runs the opposite direction from the one "welfare state" rhetoric assumes.
The sharpest version of the mismatch is a federal transfer program that dwarfs the stigma attached to SNAP and carries almost none of it: farm subsidies. The federal government paid out $478 billion in farm subsidies between 1995 and 2021, and in 2024 alone, just the top 10 percent of recipients collected 65 percent of all commodity-program payments -- a transfer that concentrates real wealth among the country's largest, most capitalized farm operations, not a safety net spread thin across need.[5] Iowa alone has collected $43.5 billion of that since 1995, more than every state except Texas -- a single state's corn and soybean growers taking in, cumulatively, roughly ninety times what Iowa's entire SNAP caseload cost the federal government in just the one year FY2022 ($455.4 million).[6][7] That comparison spans three decades of farm payments against a single year of food assistance, so it isn't an annual apples-to-apples ratio -- but even judged fairly, on an annual basis Iowa's farm subsidies still ran to roughly $1.4 billion a year on average over that period, about three times its yearly SNAP cost.[6][7] It is, structurally, the same kind of thing SNAP is: a federal check that keeps a household's income above what the market alone would provide. It is overwhelmingly rural in where it lands. And it is almost never described in the language -- "handout," "dependency," "welfare" -- that gets reached for automatically when the recipient is imagined as an urban, Black SNAP household. The word choice isn't tracking the size of the check, the rural-ness of the recipient, or even, reliably, the recipient's race. It's tracking who the country has been shown, for decades, as the face of needing help.
Rural America depends on federal assistance at a higher rate than the cities the word "welfare" gets aimed at, and receives an even larger, more concentrated federal transfer -- farm subsidies -- that carries none of the same stigma at all. This isn't a story about which group deserves help and which doesn't; every program named here is real money reaching real households that need it, cities and rural counties alike. It's a story about how a country decided, one photo-editing choice at a time, which face to put on the idea of dependency -- and then built four decades of political rhetoric on top of a picture that was never an accurate count. Rural counties, red states, and the country's largest farms have been on the receiving end of federal support this whole time. The stigma just never learned to picture them that way.